

Real-Time Log Analytics for ETL Pipelines in AWS: A Complete Project Guide
In today’s data-driven world, monitoring the health of your ETL pipelines is just as important as building them. Whether you’re a student learning cloud technologies or a beginner data engineer, understanding how to build a real-time log analytics system is a must. This guide walks you through every technical and architectural detail needed to build a fully-functional, real-world inspired project using AWS.
Project Overview
Title: Real-Time Log Analytics for ETL Pipelines Using AWS
Level: Beginner to Intermediate
Goal: To ingest, process, store, and visualize ETL job logs in real-time or near real-time, and enable monitoring and alerting.
What You Will Learn
-
Real-time data ingestion using Amazon Kinesis
-
Serverless data transformation using AWS Lambda
-
Data storage in Amazon S3
-
Schema crawling and ETL with AWS Glue
-
Querying log data using Amazon Athena
-
Building dashboards with Amazon QuickSight
-
(Optional) Setting up alerts using Amazon SNS and CloudWatch
Project Architecture
[Python Script - ETL Log Generator] ➞ [Amazon Kinesis Firehose] ➞ [Amazon S3 (Raw Logs)]
                                                ↓
                                    [AWS Lambda (optional)]
                                                ↓
                                      [AWS Glue Crawler]
                                                ↓
                                 [Athena / Redshift + QuickSight]
This architecture enables near-real-time visibility into the health and performance of your ETL jobs.
Step 1: Simulate ETL Logs
You will first create a Python script that generates synthetic ETL log entries and streams them to AWS via Kinesis.
Sample Log Format
{
  "job_id": "job-2025-06-08-001",
  "feed_name": "customer_orders",
  "status": "SUCCESS",
  "start_time": "2025-06-08T10:15:00Z",
  "end_time": "2025-06-08T10:20:00Z",
  "records_read": 12000,
  "records_written": 11950,
  "error_message": ""
}
Python Log Generator (Kinesis Producer) – Lambda Code Example
import boto3
import json
import uuid
import random
from datetime import datetime, timedelta
firehose = boto3.client('firehose', region_name='us-east-1')
FEED_NAMES = ["customer_orders", "sales_data", "inventory"]
def lambda_handler(event, context):
    start = datetime.utcnow()
    end = start + timedelta(minutes=5)
    record = {
        "job_id": f"job-{start.strftime('%Y%m%d%H%M%S')}-{uuid.uuid4().hex[:4]}",
        "feed_name": random.choice(FEED_NAMES),
        "status": random.choice(["SUCCESS", "FAILED"]),
        "start_time": start.isoformat() + 'Z',
        "end_time": end.isoformat() + 'Z',
        "records_read": random.randint(1000, 20000),
        "records_written": random.randint(1000, 20000),
        "error_message": "" if random.random() > 0.2 else "OutOfMemoryError"
    }
    response = firehose.put_record(
        DeliveryStreamName='etl-log-stream',
        Record={'Data': json.dumps(record) + "n"}
    )
    return {
        "statusCode": 200,
        "body": json.dumps({
            "message": "Record sent to Firehose",
            "data": record,
            "response": response
        })
    }
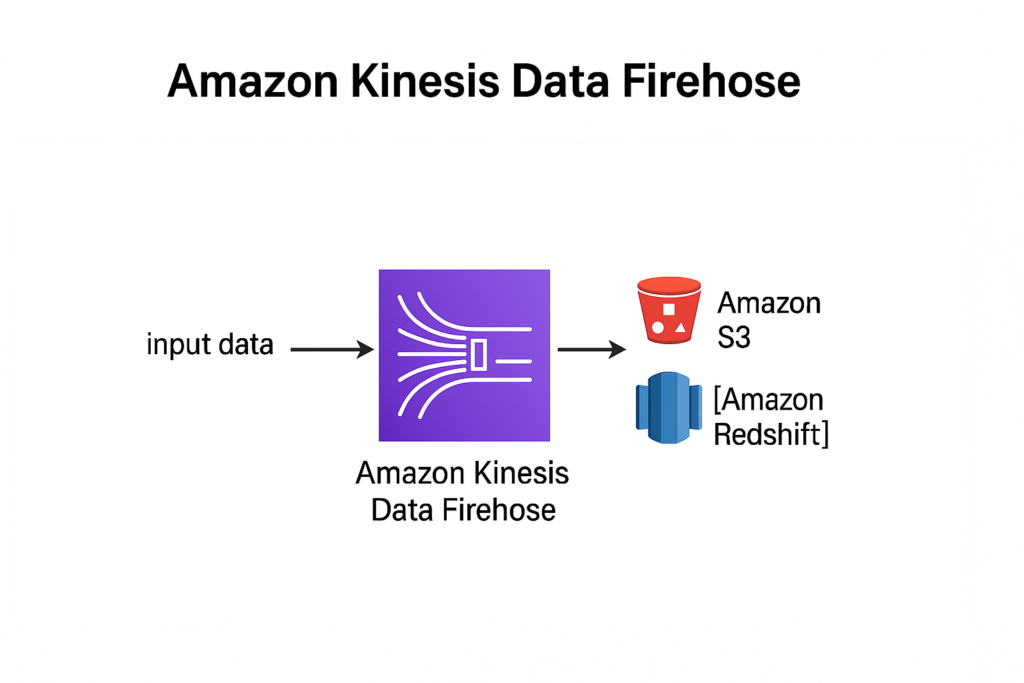
Step 2: Create Amazon Kinesis Firehose Delivery Stream
-
Go to AWS Console → Kinesis → Create Delivery Stream
-
Name:
etl-log-stream -
Source: Direct PUT or other sources
-
Destination: Amazon S3
-
Buffering hints: 1 MB or 60 seconds
-
Compression: GZIP (recommended)
-
Permissions: Create or attach an IAM role with write access to S3
Step 3: Store Logs in S3
Logs will automatically be stored in the bucket of your choice. Use a folder structure like this for partitioning:
s3://your-bucket-name/etl-logs/raw/YYYY/MM/DD/Step 4: Setup AWS Glue Crawler
Create a Crawler:
-
Source: Your S3 raw logs folder
-
Output: Create a new database
etl_log_db -
Schedule: Run on demand or every few hours
Output Table Sample Schema
job_id: string
feed_name: string
status: string
start_time: timestamp
end_time: timestamp
records_read: int
records_written: int
error_message: string
Step 5: Query Logs Using Athena
Go to Athena and run queries on your Glue catalog table.
Useful Queries:
1. Count of Success vs Failure
SELECT status, COUNT(*) AS total_jobs
FROM etl_log_db.etl_logs
GROUP BY status;
2. Average Job Duration
SELECT feed_name,
       avg(date_diff('minute', start_time, end_time)) AS avg_duration
FROM etl_log_db.etl_logs
GROUP BY feed_name;
3. Recent Failures
SELECT *
FROM etl_log_db.etl_logs
WHERE status = 'FAILED'
ORDER BY end_time DESC
LIMIT 10;
Step 6: Build Real-Time Dashboards in Amazon QuickSight
-
Connect to Athena as a new data source
-
Import your
etl_logstable -
Create visuals:
-
Bar Chart: Job Count by Status
-
Line Graph: Daily Failures
-
Table: Detailed log of failed jobs with job_id and error_message
-
(Optional)
Step 7: Set Up Alerts
 Use CloudWatch and SNS
-
Create a metric filter for “FAILED” logs
-
Set threshold: If more than 5 failures in 10 minutes, trigger SNS
-
Create an SNS topic to email alert to your team
Final Thoughts
This project isn’t just a toy problem. Real companies use similar architectures to monitor data pipelines. By building this, you:
-
Learn serverless data ingestion and processing
-
Work with real AWS services like Kinesis, S3, Glue, Athena, and QuickSight
-
Build a portfolio-ready project that demonstrates cloud-native thinking
Bonus: Portfolio Tips
-
Upload screenshots of your QuickSight dashboard
-
Add GitHub repo with simulation code and instructions
-
Write a blog post titled “How I Built Real-Time ETL Log Analytics on AWS”
Wrapping Up
This real-time log analytics system for ETL pipelines showcases your ability to think beyond the basics and handle real-world problems like data reliability, monitoring, and alerting. Whether you’re preparing for a data engineering interview or building a cloud portfolio, this is the project that speaks volumes