

In today’s data-driven world, monitoring the health of your ETL pipelines is just as important as building them. Whether you’re a student learning cloud technologies or a beginner data engineer, understanding how to build a real-time log analytics system is a must. This guide walks you through every technical and architectural detail needed to build a fully-functional, real-world inspired project using AWS.
Project Overview
Title: Real-Time Log Analytics for ETL Pipelines Using AWS
Level: Beginner to Intermediate
Goal: To ingest, process, store, and visualize ETL job logs in real-time or near real-time, and enable monitoring and alerting.
What You Will Learn
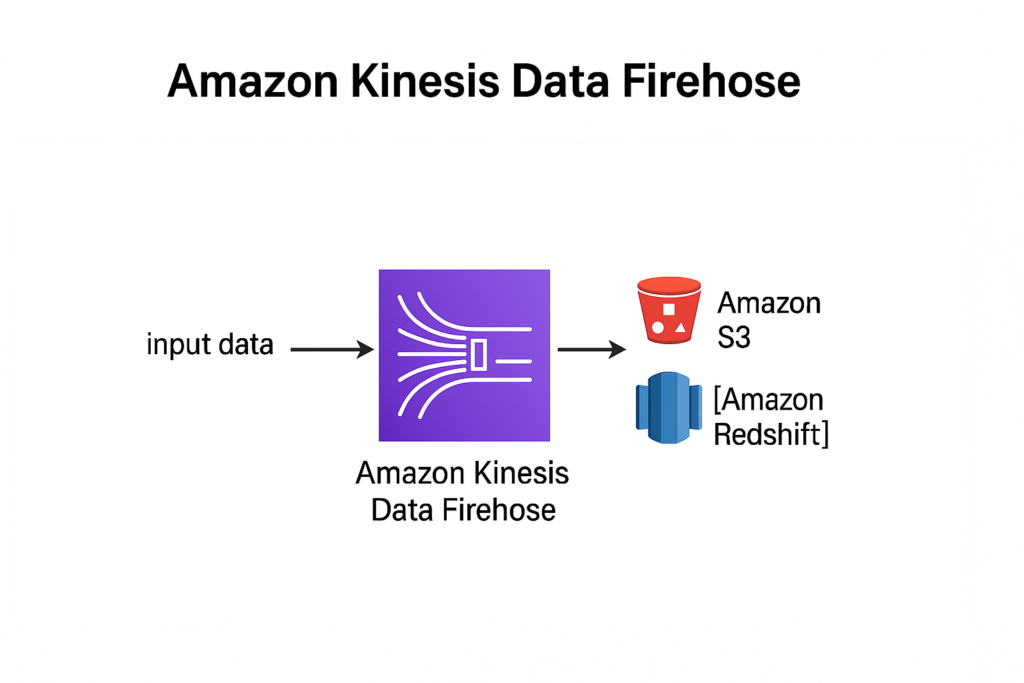
Real-time data ingestion using Amazon Kinesis
Serverless data transformation using AWS Lambda
Data storage in Amazon S3
Schema crawling and ETL with AWS Glue
Querying log data using Amazon Athena
Building dashboards with Amazon QuickSight
(Optional) Setting up alerts using Amazon SNS and CloudWatch
Project Architecture
[Python Script - ETL Log Generator] ➞ [Amazon Kinesis Firehose] ➞ [Amazon S3 (Raw Logs)]
                                                ↓
                                    [AWS Lambda (optional)]
                                                ↓
                                      [AWS Glue Crawler]
                                                ↓
                                 [Athena / Redshift + QuickSight]
This architecture enables near-real-time visibility into the health and performance of your ETL jobs.
Step 1: Simulate ETL Logs
You will first create a Python script that generates synthetic ETL log entries and streams them to AWS via Kinesis.
Sample Log Format
{
  "job_id": "job-2025-06-08-001",
  "feed_name": "customer_orders",
  "status": "SUCCESS",
  "start_time": "2025-06-08T10:15:00Z",
  "end_time": "2025-06-08T10:20:00Z",
  "records_read": 12000,
  "records_written": 11950,
  "error_message": ""
}
Python Log Generator (Kinesis Producer) – Lambda Code Example
import boto3
import json
import uuid
import random
from datetime import datetime, timedelta

firehose = boto3.client('firehose', region_name='us-east-1')

FEED_NAMES = ["customer_orders", "sales_data", "inventory"]

def lambda_handler(event, context):
    start = datetime.utcnow()
    end = start + timedelta(minutes=5)

    record = {
        "job_id": f"job-{start.strftime('%Y%m%d%H%M%S')}-{uuid.uuid4().hex[:4]}",
        "feed_name": random.choice(FEED_NAMES),
        "status": random.choice(["SUCCESS", "FAILED"]),
        "start_time": start.isoformat() + 'Z',
        "end_time": end.isoformat() + 'Z',
        "records_read": random.randint(1000, 20000),
        "records_written": random.randint(1000, 20000),
        "error_message": "" if random.random() > 0.2 else "OutOfMemoryError"
    }

    response = firehose.put_record(
        DeliveryStreamName='etl-log-stream',
        Record={'Data': json.dumps(record) + "\n"}
    )

    return {
        "statusCode": 200,
        "body": json.dumps({
            "message": "Record sent to Firehose",
            "data": record,
            "response": response
        })
    }
Step 2: Create Amazon Kinesis Firehose Delivery Stream
Go to AWS Console → Kinesis → Create Delivery Stream
Name:
etl-log-streamSource: Direct PUT or other sources
Destination: Amazon S3
Buffering hints: 1 MB or 60 seconds
Compression: GZIP (recommended)
Permissions: Create or attach an IAM role with write access to S3
Step 3: Store Logs in S3
Logs will automatically be stored in the bucket of your choice. Use a folder structure like this for partitioning:
s3://your-bucket-name/etl-logs/raw/YYYY/MM/DD/Step 4: Setup AWS Glue Crawler
Create a Crawler:
Source: Your S3 raw logs folder
Output: Create a new database
etl_log_dbSchedule: Run on demand or every few hours
Output Table Sample Schema
job_id: string
feed_name: string
status: string
start_time: timestamp
end_time: timestamp
records_read: int
records_written: int
error_message: string
Step 5: Query Logs Using Athena
Go to Athena and run queries on your Glue catalog table.
Useful Queries:
1. Count of Success vs Failure
SELECT status, COUNT(*) AS total_jobs
FROM etl_log_db.etl_logs
GROUP BY status;
2. Average Job Duration
SELECT feed_name,
       avg(date_diff('minute', start_time, end_time)) AS avg_duration
FROM etl_log_db.etl_logs
GROUP BY feed_name;
3. Recent Failures
SELECT *
FROM etl_log_db.etl_logs
WHERE status = 'FAILED'
ORDER BY end_time DESC
LIMIT 10;
Step 6: Build Real-Time Dashboards in Amazon QuickSight
Connect to Athena as a new data source
Import your
etl_logstableCreate visuals:
Bar Chart: Job Count by Status
Line Graph: Daily Failures
Table: Detailed log of failed jobs with job_id and error_message
(Optional)
Step 7: Set Up Alerts
 Use CloudWatch and SNS
Create a metric filter for “FAILED” logs
Set threshold: If more than 5 failures in 10 minutes, trigger SNS
Create an SNS topic to email alert to your team
Final Thoughts
This project isn’t just a toy problem. Real companies use similar architectures to monitor data pipelines. By building this, you:
Learn serverless data ingestion and processing
Work with real AWS services like Kinesis, S3, Glue, Athena, and QuickSight
Build a portfolio-ready project that demonstrates cloud-native thinking
Bonus: Portfolio Tips
Upload screenshots of your QuickSight dashboard
Add GitHub repo with simulation code and instructions
Write a blog post titled “How I Built Real-Time ETL Log Analytics on AWS”
Wrapping Up
This real-time log analytics system for ETL pipelines showcases your ability to think beyond the basics and handle real-world problems like data reliability, monitoring, and alerting. Whether you’re preparing for a data engineering interview or building a cloud portfolio, this is the project that speaks volumes